./dayz-exporter
DayZ Prometheus Metrics Exporter
DayZ Prometheus Metrics Exporter
Collects and publishes Prometheus metrics from Battleye RCON and Steam A2S Query for DayZ server.

DayZ Prometheus Metrics Exporter is a powerful, cross-platform solution for collecting and publishing metrics from DayZ servers, supporting all major operating systems. It offers a ready-to-use Container image for easy deployment and provides full GeoIP support for player geolocation. The exporter collects data via Battleye RCON and Steam A2S Query, offering insights into server status, online players, bans, and more. Best of all, it requires no mods to be installed on the server. With fast setup, flexibility, and scalability, it's the perfect tool for monitoring DayZ servers in any environment.
- Configuration
- Metrics
- Endpoints
- Authentication
- Setup Exporter
- Lifecycle
- Collect metrics
- Visualize in Grafana
- Support me ☕
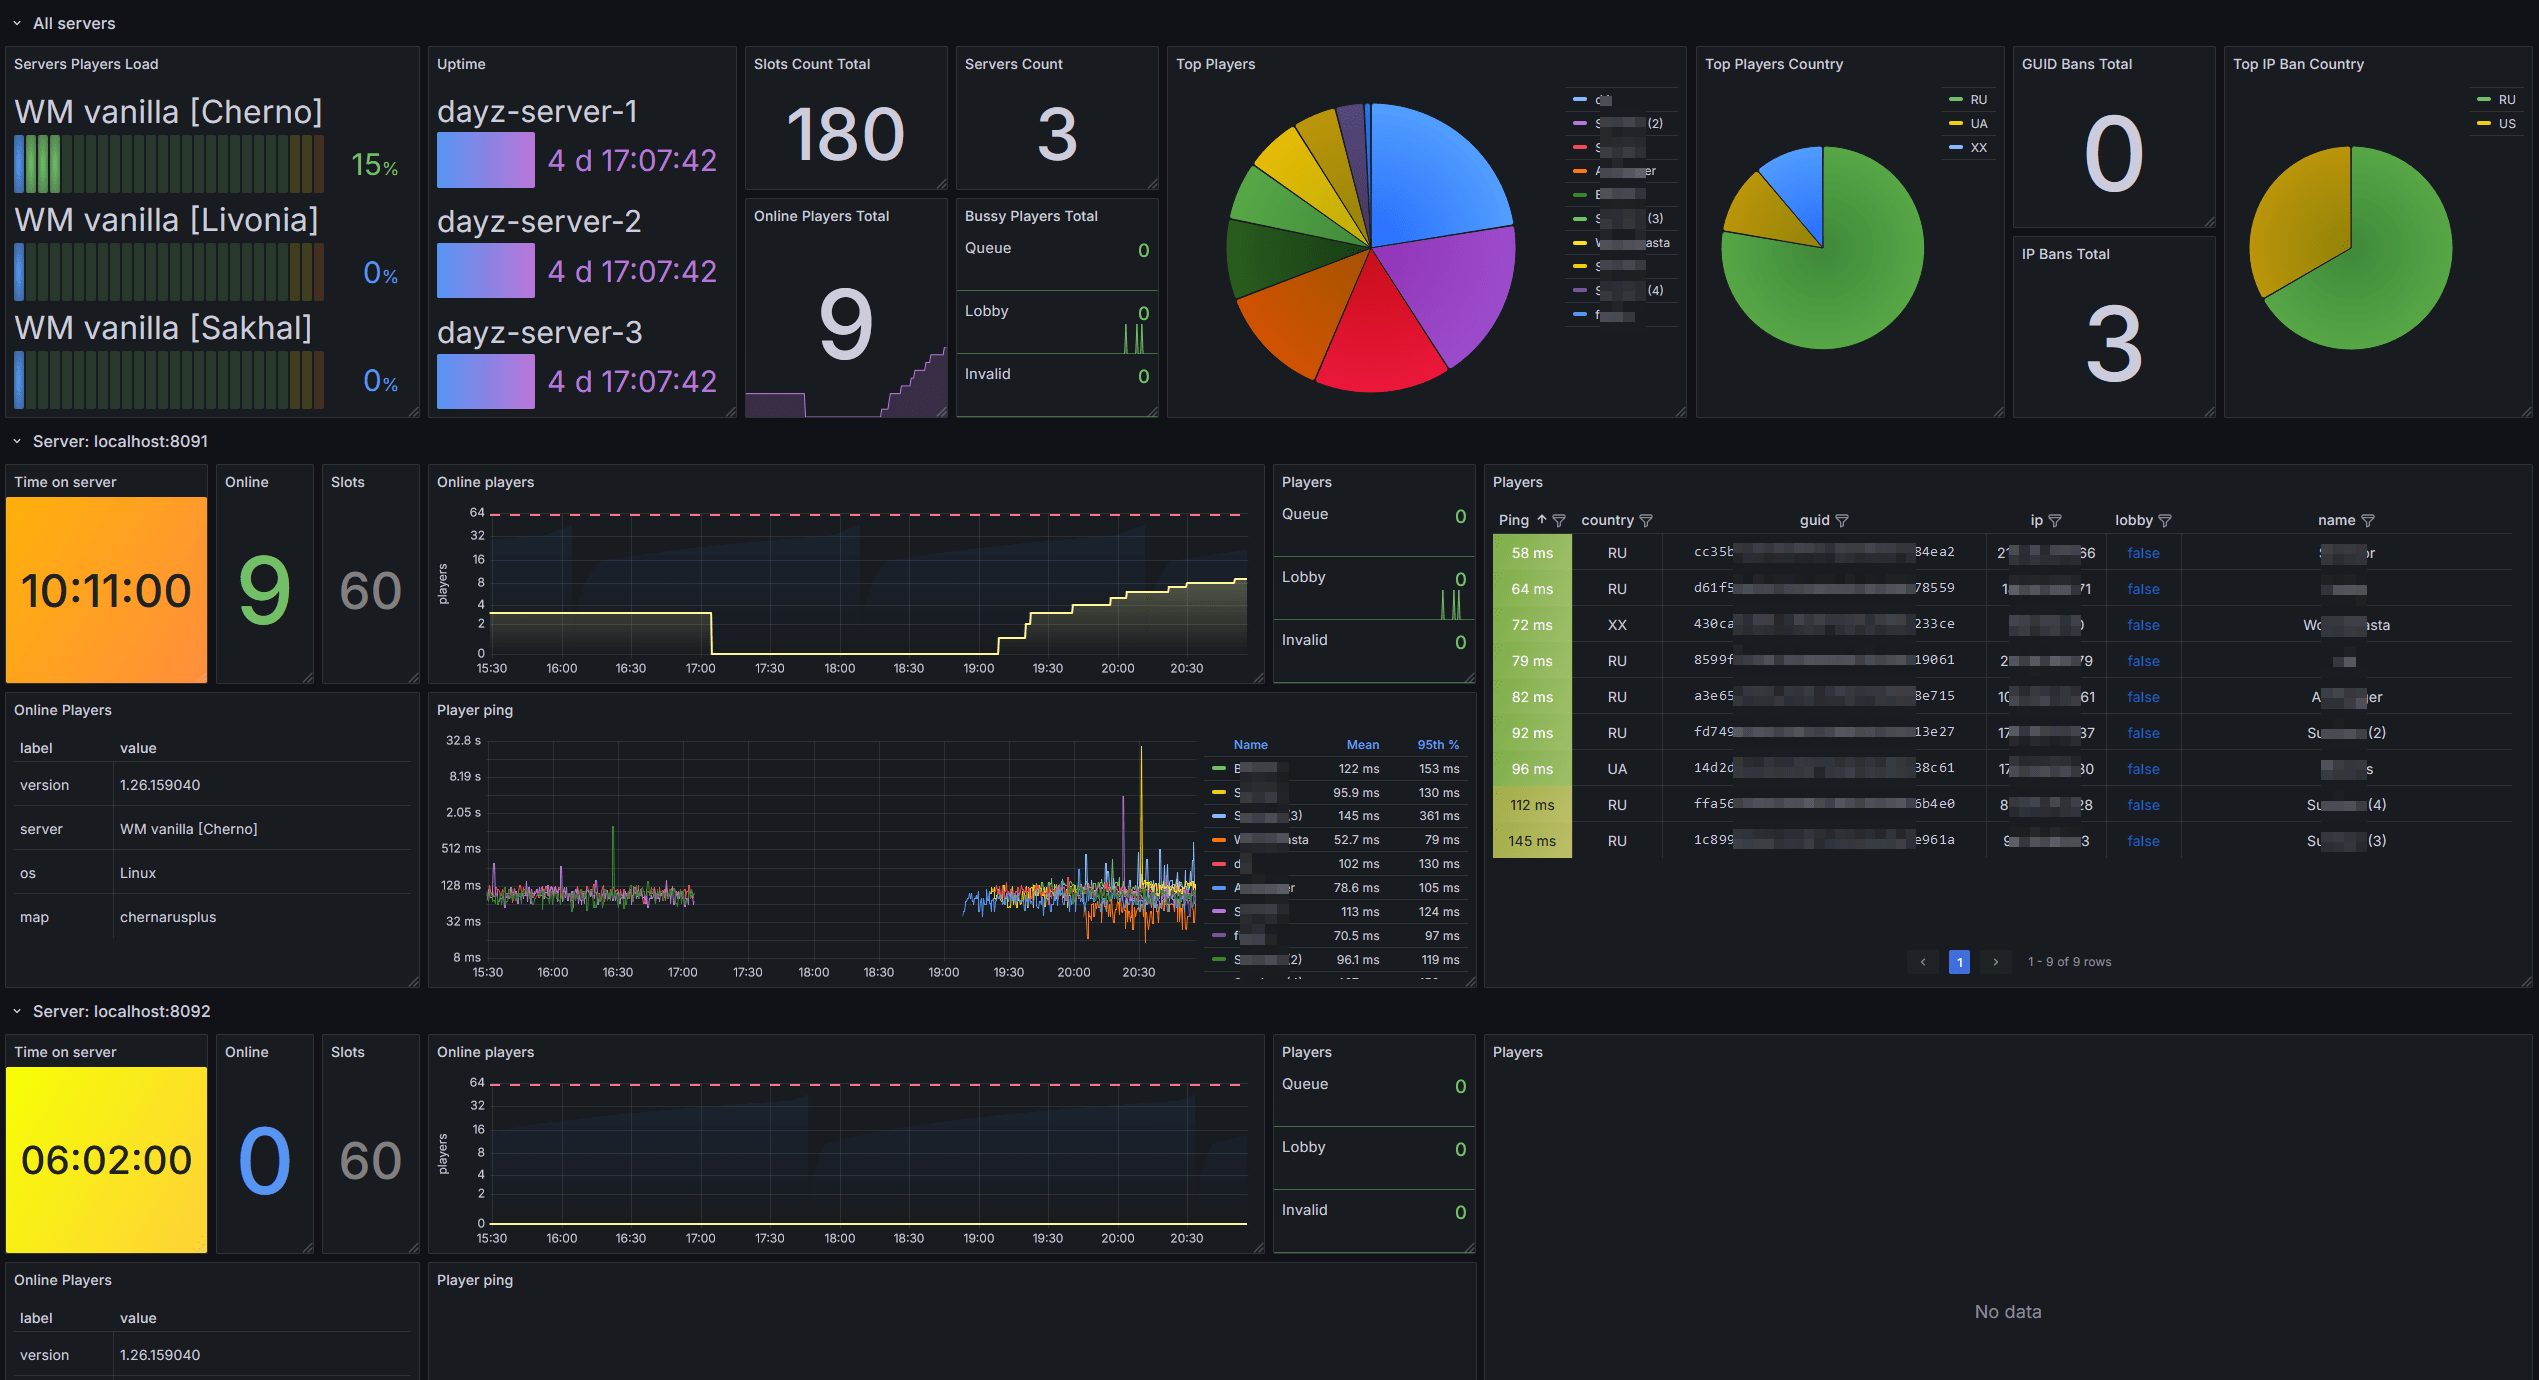
Grafana dashboard example
Configuration
Usage:
  ./dayz-exporter [option] [config.yaml]

Available options:
  -y, --get-yaml    Prints an example YAML configuration file.
  -e, --get-env     Prints an example .env file.
  -v, --version     Show version, commit, and build time.
  -h, --help        Prints this help message.
Run the program with a custom configuration file:
./dayz-exporter config.yaml
Configuration File Lookup:
- The program first checks for a configuration file specified by the
variable
DAYZ_EXPORTER_CONFIG_PATH. - If the config variable is not set, it will attempt to use a configuration file passed as a command-line argument.
- If no argument is provided, it will attempt to read from the default
file
config.yamlin the current directory.
You can get a sample YAML configuration here example.config.yaml, or save a sample YAML configuration to a file from within the application itself by running:
./dayz-exporter --get-yaml > config.yaml
You can get a sample of environment variables here example.env, or save to a file from within the application itself by running:
./dayz-exporter --get-env > dayz-exporter.env
YAML configuration options take priority over environment variables. If you use both, comment out the options in YAML that you wish to override using environment variables.
DAYZ_EXPORTER_RCON_PASSWORD=strong ./dayz-exporter config.yaml
For more information on configuration parameters, refer to the example configuration files (YAML and .env).
Metrics
Metrics collected using the A2S INFO protocol provide information about
players online, server status, etc., and a list of labels is generated.
Metrics collected by Battleye RCON provide detailed information about
each player or entry in the ban list.
Steam Query A2S INFO metrics
a2s_info_ping_seconds— Server A2S_INFO response time in seconds;a2s_info_players_online— Online players;a2s_info_players_slots— Players slots count;a2s_info_players_queue— Players wait in queue;a2s_info_time— Duration of day time on server;
Battleye RCON players metrics
bercon_player_ping_seconds— Player ping in seconds. Extra labels:name,ip,guid,lobby,countryℹ️bercon_players_total— Total count of players;bercon_players_online— Count of players online;bercon_players_lobby— Count of players in lobby;bercon_players_invalid— Count of invalid players.
Battleye RCON bans metrics (optional)
[!TIP]
By default these metrics are disabled, they should be enabled separately in the settings. Can create a large number of metrics if you have a large ban list
bercon_ban_guid_time_seconds— Time left for GUID bans in seconds. Extra labels:reason,guid;bercon_ban_guid_total— Total count of GUID bans;bercon_ban_ip_time_seconds— Time left for IP bans in seconds. Extra labels:reason,ip,countryℹ️bercon_ban_ip_total— Total count of IP bans;
Labels
server— Server name;map— Server map name;game— Game name;os— Server platform OS name;version— Game server version;- Any static additional labels can also be installed via the application configuration.
[!TIP]
countrylabel show country code name only if GeoIP database configured in server settings
Endpoints
The DayZ exporter exposes several useful endpoints for monitoring and troubleshooting:
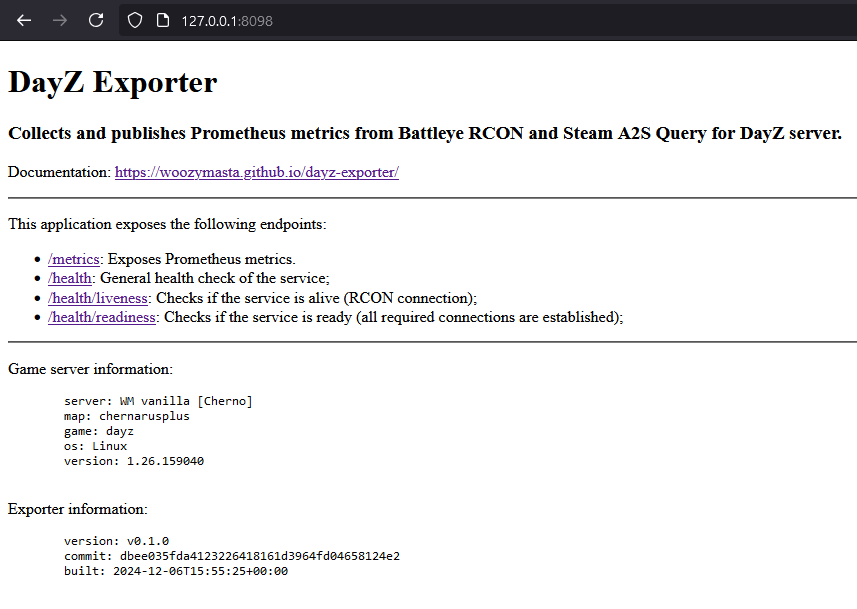
/: Provides an overview of the exporter and includes useful information about the status of the service, the connected game server, and the exporter version./metrics: Exposes Prometheus-compatible metrics. This is the main endpoint used by Prometheus to scrape metrics from the exporter. It is typically accessed by your Prometheus instance for metric collection./health: A general health check of the service. It provides an overall status of the exporter./health/liveness: A liveness check endpoint that verifies if the service is alive. This checks the RCON connection to ensure the exporter is functioning./health/readiness: A readiness check endpoint that ensures the service is fully operational, i.e., all required connections (like RCON and Steam) are established and functional./info: Returns A2S server information with parsed keywords in JSON format. This is an optional endpoint that's disabled and doesn't require authentication by default. Useful for automation scenarios, such as displaying real-time player count on your website or integrating with monitoring dashboards.
👉 Usage example for creating landing page with/info.
Index page example on/route
Authentication
Authentication can be configured through the settings. It will be enabled
if the password is provided, with the default value for username
being metrics.
[!TIP]
By default, the/health,/health/liveness, and/health/readinessroutes are excluded from authentication. You can also enable authentication for these routes by setting thehealth_authparameter totrue.
Setup Exporter
Container Image
The images are published to two container registries:
docker pull ghcr.io/woozymasta/dayz-exporter:latestdocker pull docker.io/woozymasta/dayz-exporter:latest
Quick start:
# Pull the image
docker pull ghcr.io/woozymasta/dayz-exporter:latest
# Generate an example YAML config
docker run --rm -ti ghcr.io/woozymasta/dayz-exporter:latest --get-yaml > dayz-exporter.yaml
# Edit the config file
editor dayz-exporter.yaml
# Run the container with the mounted config and exposed port
docker run --name dayz-exporter -d \
  -v "$PWD/dayz-exporter.yaml:/config.yaml" -p 8098:8098 \
  ghcr.io/woozymasta/dayz-exporter:latest
You can also use environment variables instead of a configuration file
by running --get-env to get an example and passing them
as container environment variables.
[!TIP]
When running in Kubernetes or other container orchestrators, use/health/livenessand/health/readinessendpoints to check the health and readiness of the containerized application.
Systemd service
To run the DayZ exporter as a systemd service, use the following example configuration. This ensures the exporter runs on system startup.
[Unit]
Description=DayZ Prometheus Metrics Exporter
Documentation=https://woozymasta.github.io/dayz-exporter/
Wants=network-online.target
After=network-online.target dayz-server.target

[Service]
EnvironmentFile=-/etc/dayz-exporter.env
ExecStart=/usr/bin/dayz-exporter
Restart=on-failure
RestartSec=5s

[Install]
WantedBy=multi-user.target
[!WARNING]
Do not use therootuser for production environments. It's recommended to create a dedicated user for this purpose.
Save this as /etc/systemd/system/dayz-exporter.service
and enable it using
systemctl enable dayz-exporter
systemctl start dayz-exporter
Systemd --user multiple servers
You can also use a user-specific systemd service, for example, located
in ~/.config/systemd/user/dayz-server@.service. This allows you to manage
multiple instances of the application simultaneously under the same user.
In this example, one service manages multiple server instances. Ensure
that the %i argument is added symmetrically to the server launch
parameters to map ports correctly.
[Unit]
Description=DayZ Prometheus Metrics Exporter 'Server %I'
Documentation=https://woozymasta.github.io/dayz-exporter/
Wants=network-online.target
After=network-online.target dayz-server@%i.target

[Service]
WorkingDirectory=%h/dayz/
EnvironmentFile=-%h/.dayz-exporter.env
Environment="DAYZ_EXPORTER_LISTEN_PORT=809%i"
Environment="DAYZ_EXPORTER_QUERY_PORT=2702%i"
Environment="DAYZ_EXPORTER_RCON_PORT=230%i5"
ExecStart=%h/.local/bin/dayz-exporter
Restart=on-failure
RestartSec=5s

[Install]
WantedBy=default.target
Windows service
You can run the exporter using any method that suits you, but it's recommended to use a Windows service for better management and reliability.
To register the service, assuming the application and configuration are
already downloaded and set up in the C:\dayz-exporter directory,
use the following commands:
sc.exe create dayz-exporter `
  binPath= "C:\dayz-exporter\dayz-exporter.exe C:\dayz-exporter\config.yaml" `
  DisplayName= "DayZ metrics exporter" `
  start= auto

sc.exe start dayz-exporter
sc.exe query dayz-exporter
[!TIP]
You can specify a more descriptiveDisplayName, especially if you have multiple servers or exporters running, to make management easier.
Open http://127.0.0.1:8098/ in your browser to check if the service is running properly.
Removing a Windows Service
sc.exe stop dayz-exporter
sc.exe query dayz-exporter
sc.exe delete dayz-exporter
Lifecycle
Errors like
Failed to update metricsduring game server restarts are normal behavior. The exporter terminates when the server becomes unavailable - this is expected, as it can't distinguish between a temporary 1-minute restart and a permanent shutdown.
The exporter depends on game server availability via RCON and A2S connections.
Key points:
- The exporter does not attempt to reconnect - it exits on connection loss
- Restart is handled by Systemd/Windows services, or container policies (Docker/Podman/K8s)
- Possible recommendations:
- Configure joint restart/stop for both server and exporter
- Set up exporter as a service dependent on the game server
- Start exporter only after full server initialization or add a simple delay
- Or just ignore it
Collect metrics
Ensure that you have a running Prometheus instance to collect metrics from the DayZ exporter.
To configure Prometheus, add the following job to your prometheus.yml file:
scrape_configs:
  - job_name: dayz
    # scrape_interval: 1m
    static_configs:
      - targets:
        - '<DAYZ_EXPORTER_HOST>:8091'
        - '<DAYZ_EXPORTER_HOST>:8092'
        - '<DAYZ_EXPORTER_HOST>:8093'
Replace <DAYZ_EXPORTER_HOST> with the IP or hostname of your DayZ exporter
instance.
[!TIP]
By default, Prometheus collects metrics every 15 seconds. However, this frequency can be too high, especially for game-related metrics, and may increase the amount of data stored. Consider adjusting the scrape interval to a longer period (e.g., 1 minute) if the default frequency is not necessary.
Optional: Process Exporter
If you wish to collect resource utilization metrics (e.g., CPU, memory) for your DayZ servers, and also populate the uptime panel in Grafana, you can use the optional process-exporter. This will collect and expose additional metrics to Prometheus.
Once the process exporter is installed and configured, it will collect and expose resource metrics to Prometheus. It will also provide additional data that will be displayed in the Grafana dashboard.
Example configuration for the process exporter to collect DayZ server process metrics:
process_names:
  - name: "dayz--"
    exe:
      - "DayZServer"
    cmdline:
      - '-config=(.*\/)?(?P<ConfigName>.*)\.cfg'
      - '-port=(.*\/)?(?P<Port>[0-9]+)'
Don't forget to also add metrics collection with process-exporter
to scrape_configs in Prometheus.
Visualize in Grafana
To visualize the collected metrics, you'll need a running Grafana instance.
-
Main Dashboard: Import the main dashboard from the file dayz-rcon.json or by ID 22457 from the Grafana dashboards.
This dashboard will display key metrics, such as player counts and other relevant information. -
Optional: Process Exporter Dashboard: If you have set up the process exporter, import the additional dashboard from system-process.json or by ID 22458 from the Grafana dashboards.
This dashboard provides insights into resource utilization (CPU, memory, etc.) for your DayZ servers.
Support me ☕
If you enjoy my projects and want to support further development, feel free to donate! Every contribution helps to keep the work going. Thank you!
Crypto Donations
- BTC:
1Jb6vZAMVLQ9wwkyZfx2XgL5cjPfJ8UU3c - USDT (TRC20):
TN99xawQTZKraRyvPAwMT4UfoS57hdH8Kz - TON:
UQBB5D7cL5EW3rHM_44rur9RDMz_fvg222R4dFiCAzBO_ptH
Your support is greatly appreciated!

